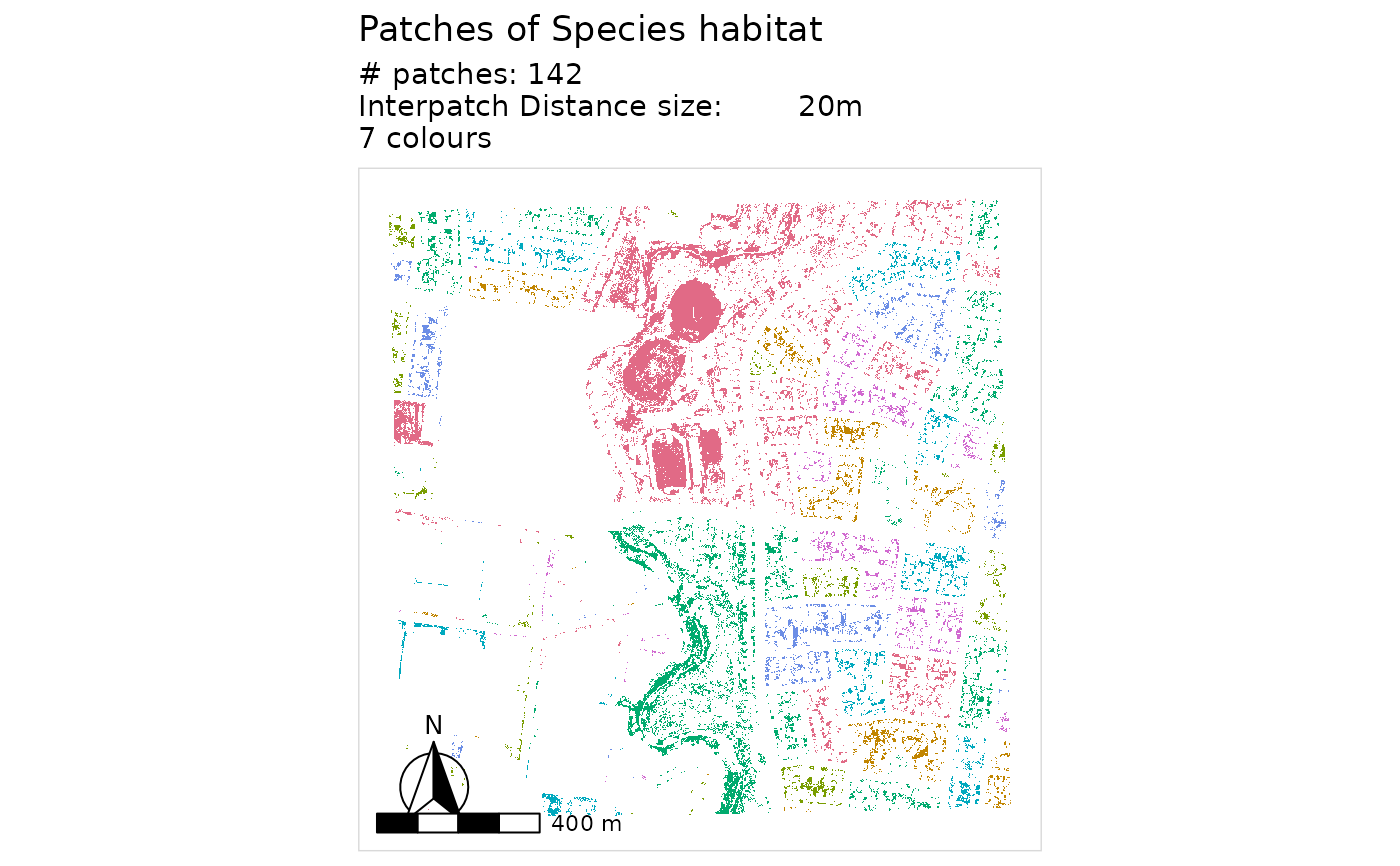
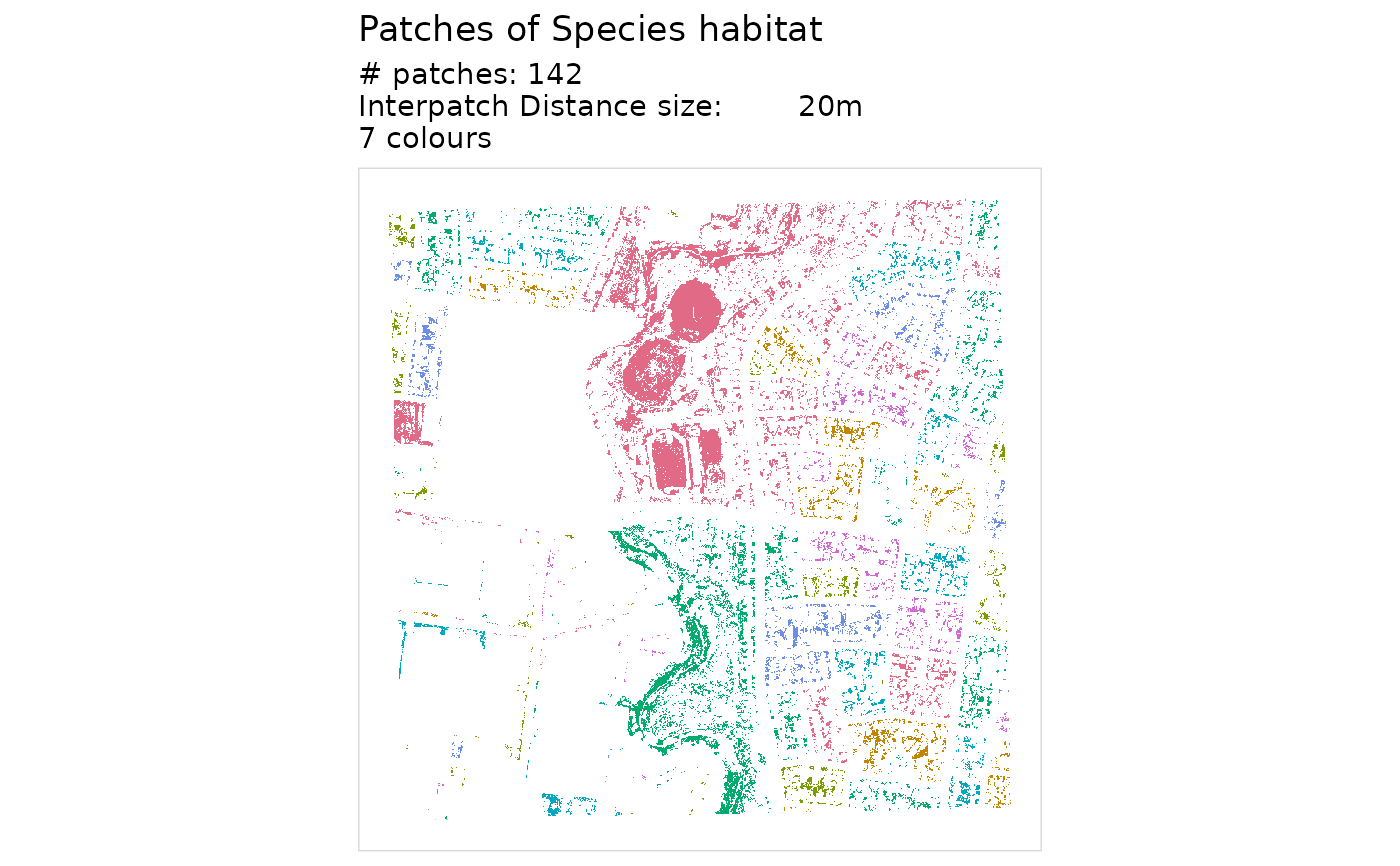
Visualizes habitat patches colored by their connected fragment ID.
Arguments
- patch_id
Terra SpatRaster. Raster with patch IDs.
- interpatch_distance
Numeric. The distance (in meters) where habitat patches are considered connected. E.g., if set to 500, patches 498m apart are connected, those 501m apart are not connected. This is passed internally to a spatial operation known as "buffering", where this distance is used as a radius from the edge of the habitat zone. This means the specified
interpatch_distanceis halved exactly. So an interpatch distance of 500 will be converted to 250.- species
Character. Species name (default: "Species").
- n_cols
Integer. Number of colors to cycle through (default: 7).
Examples
lizard_habitat <- example_habitat()
lizard_barrier <- example_barrier()
interpatch_distance <- 20
buffer_radius <- interpatch_distance / 2
buffered_habitat <- habitat_buffer(lizard_habitat, buffer_radius)
barrier_mask <- create_barrier_mask(lizard_barrier)
fragmented <- fragment_habitat(buffered_habitat, barrier_mask)
remaining_habitat <- drop_habitat_under_barrier(
  habitat = lizard_habitat,
  barrier = lizard_barrier
  )
fragment_patches <- assign_patches_to_fragments(
  remaining_habitat = remaining_habitat,
  fragment = fragmented
  ) |> add_patch_area()

plot_patches(fragment_patches, interpatch_distance = interpatch_distance)
#> <SpatRaster> resampled to 500554 cells.


#' add north arrow and scale bar with ggspatial
library(ggspatial)
library(tidyterra)
plot_patches(fragment_patches, interpatch_distance = interpatch_distance) +
 annotation_north_arrow(
   style = north_arrow_fancy_orienteering()
  ) +
  annotation_scale()
#> <SpatRaster> resampled to 500554 cells.
#' add north arrow and scale bar with ggspatial
library(ggspatial)
library(tidyterra)
plot_patches(fragment_patches, interpatch_distance = interpatch_distance) +
annotation_north_arrow(
style = north_arrow_fancy_orienteering()
) +
annotation_scale()
#> <SpatRaster> resampled to 500554 cells.